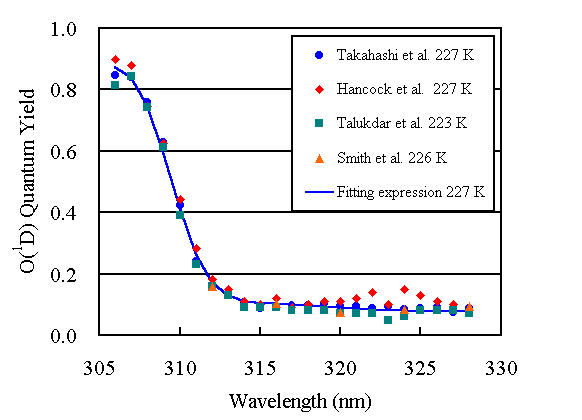
O(1D) FigTab 7 Plots the low temperature (227 K) values, which show all the experimental data used and the curve obatined from the fitting expression