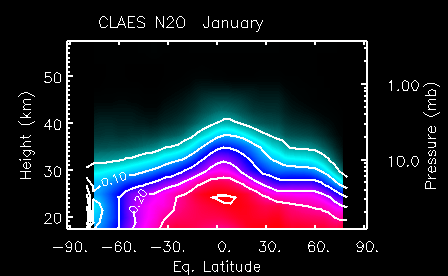
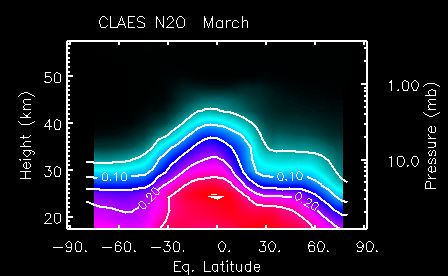
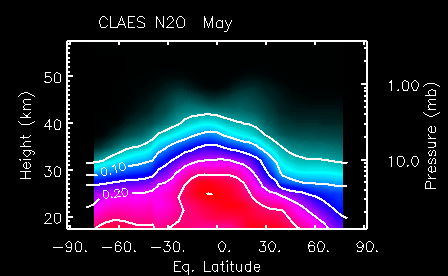
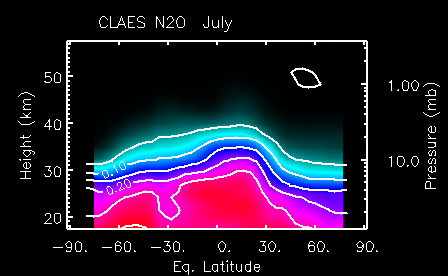
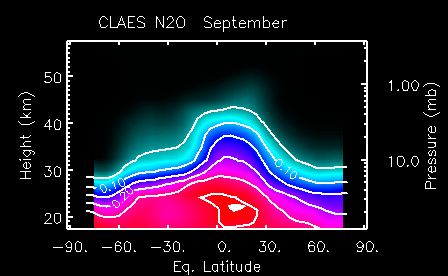
Monthly averages of N2O observations from UARS CLAES as a function of height and potential vorticity expressed in terms of equivalent latitude (Randel et al., 1994). Contour interval is 0.05 ppmv.

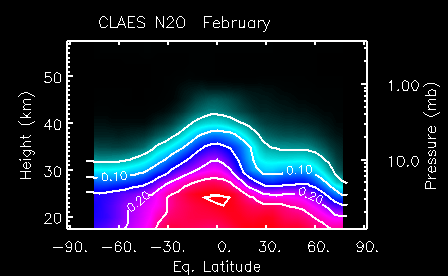
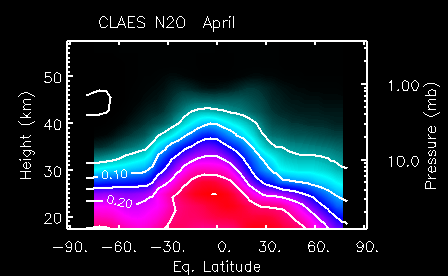
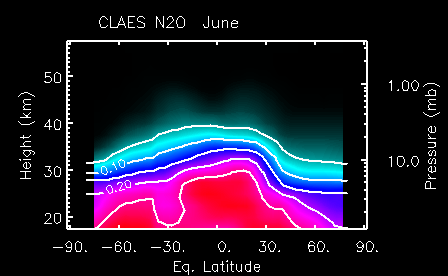
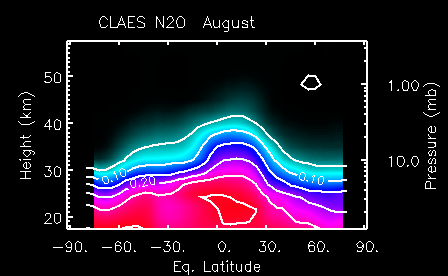
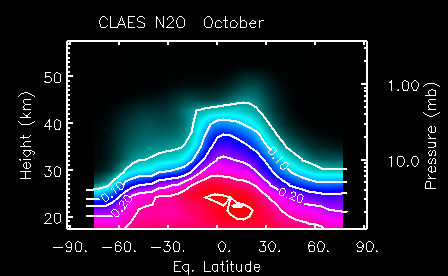
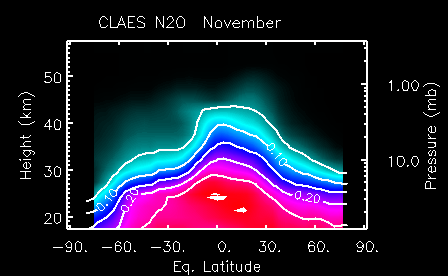
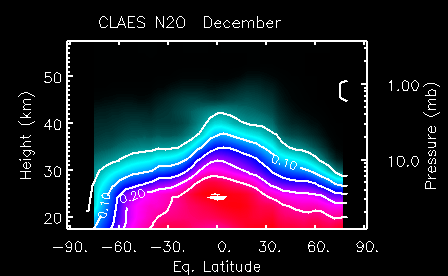

Monthly averages of N2O observations from UARS CLAES as a function of height and potential vorticity expressed in terms of equivalent latitude (Randel et al., 1994). Contour interval is 0.05 ppmv.