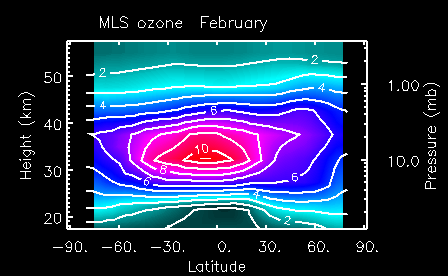
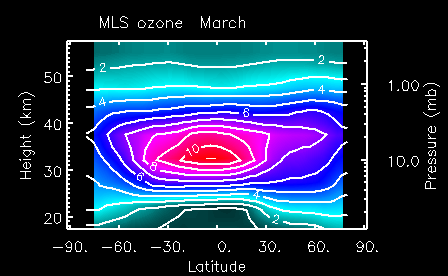
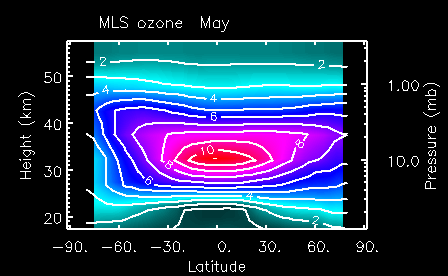
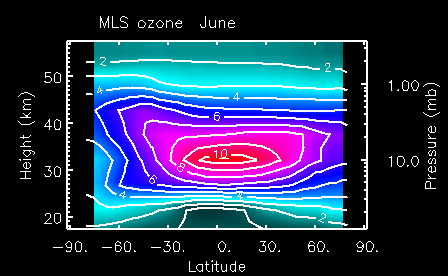
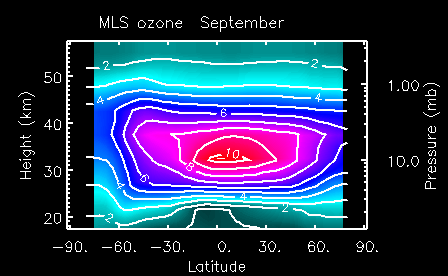
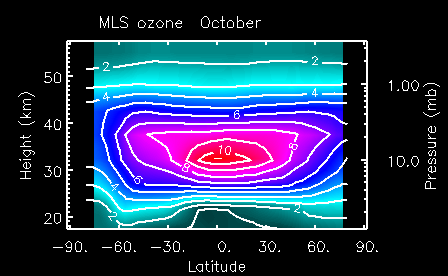
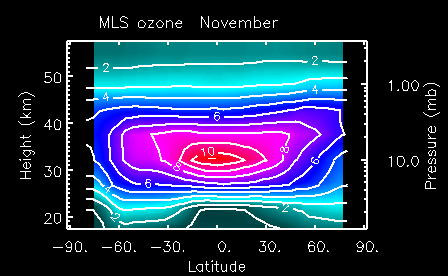
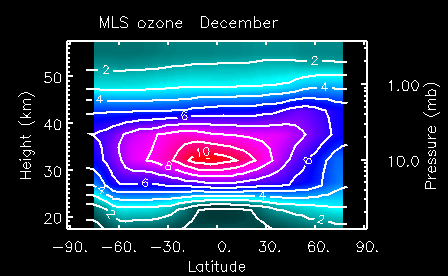
Monthly averages of O3 observations from UARS MLS as a function of height and and potential vorticity expressed in terms of equivalent latitude. Contour interval is 1 ppmv.

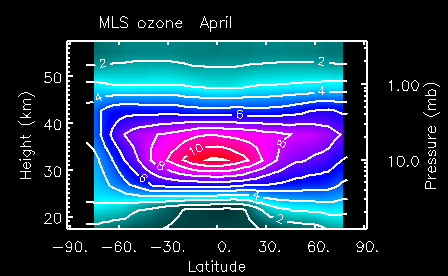
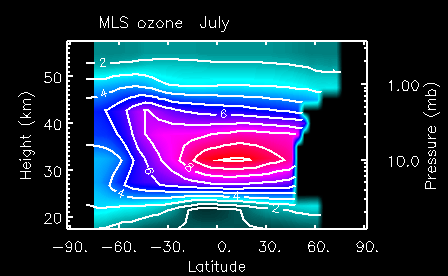
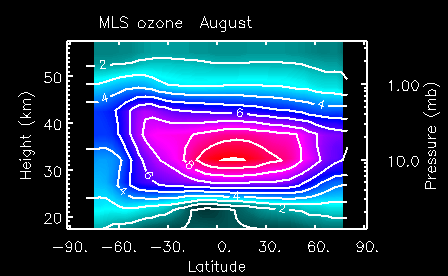

Monthly averages of O3 observations from UARS MLS as a function of height and and potential vorticity expressed in terms of equivalent latitude. Contour interval is 1 ppmv.