
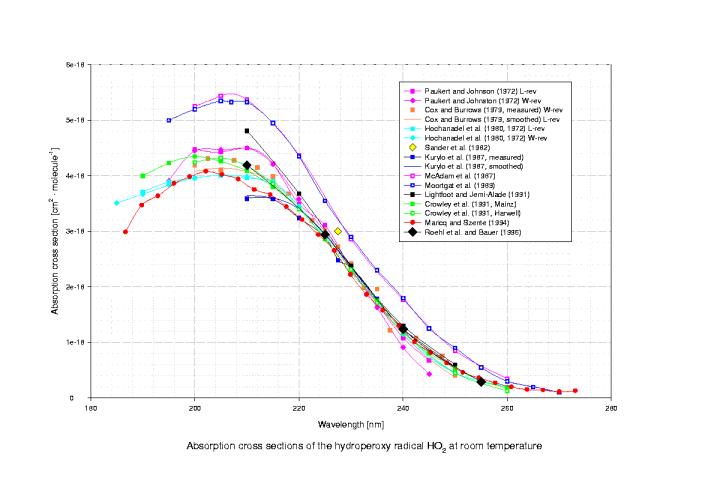
Figure 11. Published Cross Sections for HO2
Download high resolution image: pdf
Table 13. Reported HO2 UV Absorption Cross Sections (10-18 cm2molecule-1)
| PJ72a | CB79a | HSO80a | SPWP82 | KWO87 | MVL87 | MVL89 | LJ91 | CSBMJC91b | MS94 | RBM96 | |
|---|---|---|---|---|---|---|---|---|---|---|---|
| 185 | 3.51 | ||||||||||
| 186.7 | 2.99 | ||||||||||
| 189.8 | 3.47 | ||||||||||
| 190 | 3.67 | 4.00 | |||||||||
| 192.9 | 3.64 | ||||||||||
| 195 | 3.91 | 3.83 | 5.00 | 4.23 | |||||||
| 196 | 386 | ||||||||||
| 199 | 3.98 | ||||||||||
| 200 | 4.45 | 4.19 | 3.96 | 5.25 | 5.20 | 4.35 – 4.24 | |||||
| 201.1 | 4.08 | ||||||||||
| 202.5 | 4.31 | ||||||||||
| 205 | 4.47 | 4.10 | 4.01 | 5.44 | 5.35 | 4.26 – 4.32 | |||||
| 205.2 | 4.02 | ||||||||||
| 207 | 5.33 | ||||||||||
| 207.5 | 4.28 | ||||||||||
| 208.3 | 3.94 | ||||||||||
| 210 | 4.50 | 4.17 | 3.99 | 3.65 | 5.37 | 5.30 | 4.81 | 4.09 – 4.18 | 4.19 | ||
| 211.4 | 3.75 | ||||||||||
| 212 | 4.15 | ||||||||||
| 214.5 | 3.66 | ||||||||||
| 215 | 4.21 | 3.99 | 3.85 | 3.60 | 4.95 | 3.80 – 3.86 | |||||
| 217.6 | 3.44 | ||||||||||
| 218 | 3.68 | ||||||||||
| 220 | 3.58 | 3.45 | 3.45 | 3.40 | 4.37 | 4.35 | 3.68 | 3.40 – 3.40 | |||
| 220.6 | 3.21 | ||||||||||
| 222.5 | 3.20 | ||||||||||
| 223.7 | 2.94 | ||||||||||
| 225 | 2.99 | 3.02 | 2.95 | 3.55 | 2.86 – 2.89 | 2.94 | |||||
| 226.8 | 2.65 | ||||||||||
| 227.5 | 2.72 | 3.00 | 2.65 | ||||||||
| 299.9 | 2.22 | ||||||||||
| 230 | 2.31 | 2.42 | 2.36 | 2.35 | 2.86 | 2.90 | 2.38 | 2.25 – 2.31 | |||
| 232.5 | 1.98 | ||||||||||
| 233 | 1.86 | ||||||||||
| 235 | 163 | 1.96 | 1.75 | 2.30 | 1.75 – 1.71 | ||||||
| 236.1 | 1.58 | ||||||||||
| 237.5 | 1.22 | ||||||||||
| 239.2 | 1.30 | ||||||||||
| 240 | 0.91 | 1.16 | 1.15 | 1.25 | 1.77 | 1.80 | 1.30 | 1.20 – 1.18 | 1.24 | ||
| 242.2 | 1.01 | ||||||||||
| 242.5 | 1.08 | ||||||||||
| 245 | 0.43 | 0.83 | 0.85 | 1.25 | 0.81 | ||||||
| 245.3 | 0.82 | ||||||||||
| 247.5 | 0.76 | ||||||||||
| 248.4 | 0.63 | ||||||||||
| 250 | 0.41 | 0.45 | 0.55 | 0.85 | 0.90 | 0.60 | 0.53 – 0.45 | ||||
| 251.5 | 0.46 | ||||||||||
| 254.6 | 0.36 | ||||||||||
| 255 | 0.55 | 0.31 | 0.29 | ||||||||
| 257.7 | 0.27 | ||||||||||
| 260 | 0.18 | 0.35 | 0.30 | 0.18 | |||||||
| 260.8 | 0.20 | ||||||||||
| 263.8 | 0.15 | ||||||||||
| 265 | 0.20 | ||||||||||
| 266.9 | 0.14 | ||||||||||
| 270 | 0.10 | 0.11 | |||||||||
| 273.1 | 0.11 |
a) Value from review by Wallington et al. (1992) read from figure in original paper; b) Two sets of measurements, molecular modulation or flash photolysis.
PJ: Paukert and Johnston, 1972; CB: Cox and Burrows, 1979; HSO: Hochanadel, Sworski and Ogren, 1980; recalibrated original spectrum from Hochanadel et al. 1972; SPWP: Sander, Peterson, Watson and Patrick, 1982; KWO: Kurylo, Wallington and Ouellette, 1987; MVL 87: McAdam, Veyret and Lesclaux, 1987; MVL 89: Moortgat, Veyret and Lesclaux, 1989; LJ: Lightfoot and Jemi-Alade, 1991; CSBMJC: Crowley, Simon, Burrows, Moortgat, Jenkin and Cox, 1991; MS: Maricq and Szente, 1994; RBM: Roehl, Bauer and Moortgat, 1996 (data point at 255 nm from Bauer, 1997)