
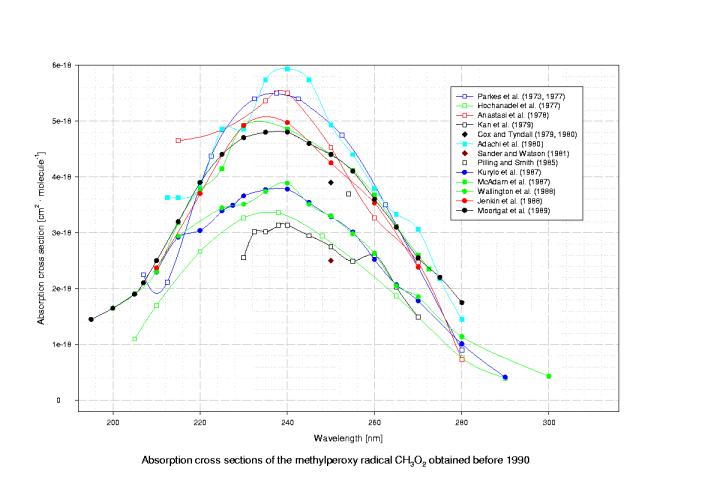
Figure 12. Published Cross Sections for CH3O2 (before 1990)
Download high resolution image: pdf
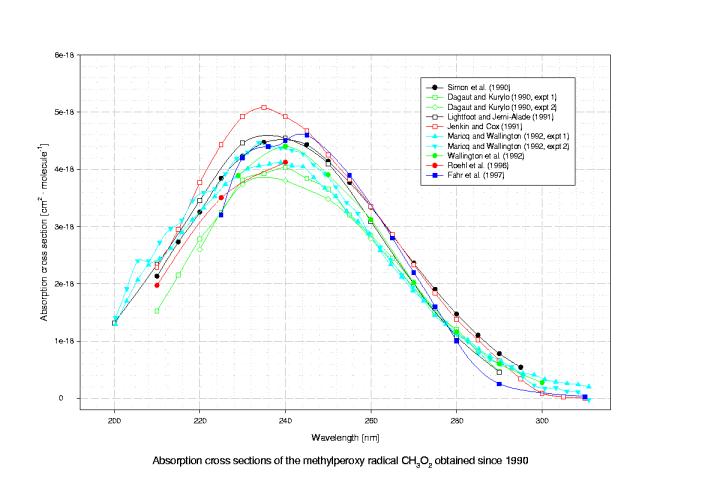
Figure 13. Published Cross Sections for CH3O2 (since 1990)
Download high resolution image: pdf
Table 14. Reported CH3O2 UV Absorption Cross sections (10-18 cm2molecule-1)
| PPQR 73 | HGBO 77 | ASP 78 | KMWC 79 | CT 79, 80 | ABJ 80 | SW 80, 81 | PS 85 | MVL 87 | KWO 87 | WDK 88 | |
|---|---|---|---|---|---|---|---|---|---|---|---|
| 195 | |||||||||||
| 200 | 1.65 | ||||||||||
| 200.3 | |||||||||||
| 202.9 | |||||||||||
| 205 | 1.1 | 1.91 | |||||||||
| 205.5 | |||||||||||
| 207 | 2.25 | ||||||||||
| 208 | |||||||||||
| 210 | 1.7 | 2.31 | 2.3 | ||||||||
| 210.6 | |||||||||||
| 212.5 | 2.12 | ||||||||||
| 213.2 | |||||||||||
| 215 | 4.65 | 3.64 | 3.18 | 2.92 | 2.94 | ||||||
| 215.8 | |||||||||||
| 218.3 | |||||||||||
| 220 | 2.67 | 3.81 | 3.78 | 3.04 | |||||||
| 220.9 | |||||||||||
| 222.5 | 4.37 | ||||||||||
| 223.5 | |||||||||||
| 225 | 4.85 | 4.85 | 4.15 | 3.39 | 3.44 | ||||||
| 226 | |||||||||||
| 227.5 | 3.49 | ||||||||||
| 228.8 | |||||||||||
| 229 | |||||||||||
| 230 | 3.27 | 2.59 | 4.84 | 4.92 | 3.66 | 3.51 | |||||
| 231.2 | |||||||||||
| 232.5 | 5.4 | 3.04 | |||||||||
| 233.8 | |||||||||||
| 235 | 5.36 | 3.04 | 5.72 | 3.77 | 3.74 | ||||||
| 236 | |||||||||||
| 236.3 | |||||||||||
| 237.5 | 5.5 | ||||||||||
| 238 | 3.36 | 3.17 | |||||||||
| 238.9 | |||||||||||
| 240 | 5.5 | 3.17 | 5.91 | 4.86 | 3.78 | 3.89 | |||||
| 241.5 | |||||||||||
| 242.5 | 5.4 | ||||||||||
| 244.1 | |||||||||||
| 245 | 2.99 | 5.72 | 3.54 | 3.51 | |||||||
| 246.6 | |||||||||||
| 248 | 2.94 | ||||||||||
| 249.2 | |||||||||||
| 250 | 4.53 | 2.8 | 3.8 | 4.93 | 2.45 | 4.41 | 3.29 | 3.3 | |||
| 251.8 | |||||||||||
| 252.5 | 4.75 | ||||||||||
| 254 | 3.7 | ||||||||||
| 254.3 | |||||||||||
| 255 | 2.52 | 4.39 | 4.12 | 3.01 | 2.98 | ||||||
| 256.9 | |||||||||||
| 259.5 | |||||||||||
| 260 | 3.27 | 2.64 | 3.78 | 3.68 | 2.52 | 2.63 | |||||
| 262.1 | |||||||||||
| 262.5 | 3.5 | ||||||||||
| 264.6 | |||||||||||
| 265 | 1.87 | 2.03 | 3.34 | 3.12 | 2.07 | 2.05 | |||||
| 267.2 | |||||||||||
| 269.8 | |||||||||||
| 270 | 2.47 | 1.5 | 3.06 | 2.6 | 1.78 | 1.85 | |||||
| 272.3 | |||||||||||
| 272.5 | 2.35 | ||||||||||
| 274.9 | |||||||||||
| 275 | 2.21 | ||||||||||
| 277.5 | |||||||||||
| 280 | 0.9 | 0.76 | 0.73 | 1.48 | 1.01 | 1.14 | |||||
| 280.1 | |||||||||||
| 282.6 | |||||||||||
| 285 | |||||||||||
| 285.2 | |||||||||||
| 287.8 | |||||||||||
| 290 | 0.4 | 0.41 | 0.43 | ||||||||
| 290.4 | |||||||||||
| 292.9 | |||||||||||
| 295 | |||||||||||
| 295.5 | |||||||||||
| 298.1 | |||||||||||
| 300 | |||||||||||
| 300.6 | |||||||||||
| 303.2 | |||||||||||
| 305 | |||||||||||
| 305.8 | |||||||||||
| 308.4 |
Table 14. Cont.
| JCHW 88 | MVL 89 | SSM 90 | DK 90 | LJ 91 | MW 92 | WMEN 92 | JC 91 | RBM 96 | FLKO 97 | |
|---|---|---|---|---|---|---|---|---|---|---|
| 195 | 1.45 | |||||||||
| 200 | 1.65 | 1.32 | ||||||||
| 200.3 | 1.35 | |||||||||
| 202.9 | 1.8 | |||||||||
| 205 | 1.9 | |||||||||
| 205.5 | 2.23 | |||||||||
| 207 | 2.1 | |||||||||
| 208 | 2.37 | |||||||||
| 210 | 2.37 | 2.5 | 2.13 | 1.53 | 2.34 | 1.97 | 1.97 | |||
| 210.6 | 2.58 | |||||||||
| 212.5 | ||||||||||
| 213.2 | 2.79 | |||||||||
| 215 | 3.2 | 2.73 | 2.15 | 2.54 | ||||||
| 215.8 | 3.01 | |||||||||
| 218.3 | 3.28 | |||||||||
| 220 | 3.7 | 3.9 | 3.25 | 2.78 | 3.46 | 3.24 | ||||
| 220.9 | 3.46 | |||||||||
| 222.5 | ||||||||||
| 223.5 | 3.6 | |||||||||
| 225 | 4.4 | 3.84 | 3.25 | 3.81 | 3.5 | 3.2 | ||||
| 226 | 3.83 | |||||||||
| 227.5 | ||||||||||
| 228.8 | 4.03 | |||||||||
| 229 | 3.89 | |||||||||
| 230 | 4.92 | 4.7 | 4.23 | 3.81 | 4.46 | 4.23 | 4.2 | |||
| 231.2 | 4.15 | |||||||||
| 232.5 | ||||||||||
| 233.8 | 4.26 | |||||||||
| 235 | 4.8 | 4.47 | 3.93 | 4.36 | ||||||
| 236 | 4.4 | |||||||||
| 236.3 | 4.24 | |||||||||
| 237.5 | ||||||||||
| 238 | ||||||||||
| 238.9 | 4.25 | |||||||||
| 240 | 4.97 | 4.8 | 4.52 | 4.03 | 4.55 | 4.4 | 4.23 | 4.12 | 4.5 | |
| 241.5 | 4.19 | |||||||||
| 242.5 | ||||||||||
| 244.1 | 4.16 | |||||||||
| 245 | 4.6 | 4.43 | 3.84 | 4.02 | 4.6 | |||||
| 246.6 | 3.97 | |||||||||
| 248 | ||||||||||
| 249.2 | 3.8 | |||||||||
| 250 | 4.25 | 4.4 | 4.14 | 3.65 | 4.1 | 3.9 | 3.65 | |||
| 251.8 | 3.61 | |||||||||
| 252.5 | ||||||||||
| 254 | ||||||||||
| 254.3 | 3.35 | |||||||||
| 255 | 4.1 | 3.77 | 3.2 | 3.29 | 3.9 | |||||
| 256.9 | 3.16 | |||||||||
| 259.5 | 2.88 | |||||||||
| 260 | 3.53 | 3.6 | 3.34 | 2.84 | 3.09 | 3.12 | 2.88 | |||
| 262.1 | 2.61 | |||||||||
| 262.5 | ||||||||||
| 264.6 | 2.38 | |||||||||
| 265 | 3.1 | 2.85 | 2.45 | 2.46 | 2.8 | |||||
| 267.2 | 2.14 | |||||||||
| 269.8 | 1.91 | |||||||||
| 270 | 2.38 | 2.55 | 2.36 | 2 | 2 | 2.02 | 2.01 | 2.2 | ||
| 272.3 | 1.71 | |||||||||
| 272.5 | ||||||||||
| 274.9 | 1.52 | |||||||||
| 275 | 2.2 | 1.9 | 1.49 | 1.58 | 1.6 | |||||
| 277.5 | 1.31 | |||||||||
| 280 | 1.75 | 1.47 | 1.2 | 1.08 | 1.16 | 1.18 | 1 | |||
| 280.1 | 1.12 | |||||||||
| 282.6 | 1.01 | |||||||||
| 285 | 1.1 | 0.81 | 0.88 | 1.04 | ||||||
| 285.2 | 0.83 | |||||||||
| 287.8 | 0.71 | |||||||||
| 290 | 0.78 | 0.47 | 0.46 | 0.6 | 0.57 | 0.25 | ||||
| 290.4 | 0.62 | |||||||||
| 292.9 | 0.54 | |||||||||
| 295 | 0.54 | 0.29 | ||||||||
| 295.5 | 0.41 | |||||||||
| 298.1 | 0.32 | |||||||||
| 300 | 0.27 | 0.08 | ||||||||
| 300.6 | 0.25 | |||||||||
| 303.2 | 0.24 | |||||||||
| 305 | 0.02 | |||||||||
| 305.8 | 0.19 | |||||||||
| 308.4 | 0.17 |
PPQR: Parkes, Paul, Quinn and Robson, 1973; HGBO: Hochanadel, Ghormley, Boyle and Ogren, 1977; ASP: Anastasi, Smith and Parkes, 1978; KMWC: Kan, McQuigg, Whitbeck and Calvert, 1979; CT: Cox and Tyndall, 1979/80; ABJ: Adachi, Basco and James, 1980; SW: Sander and Watson, 1980/81; PS: Pilling and Smith, 1985; MVL 87: McAdam, Veyret and Lesclaux, 1987; KWO: Kurylo, Wallington and Ouellette, 1987; WDK: Wallington, Dagaut and Kurylo, 1988; JCHW: Jenkin, Cox, Hayman and Whyte, 1988; MVL 89: Moortgat, Veyret and Lesclaux, 1989; SSM: Simon, Schneider and Moortgat, 1990; DK: Dagaut and Kurylo, 1990; LJ: Lightfoot and Jemi-Alade, 1991; MW: Maricq and Wallington, 1992 (average of 2 spectra); WMEN: Wallington, Maricq, Ellerman and Nielsen, 1992; JC: Jenkin and Cox, 1991 (only relative values, normalized at 230 and 240 nm); RBM: Roehl, Bauer and Moortgat, 1996 / from Ph.D. Thesis of D. Bauer Mainz 1997; FLKO: Fahr, Laufer, Krauss and Osman, 1997.