
Figure 2. Reaction2 CH3O2 + CH3O2 Kinetics (k observed)
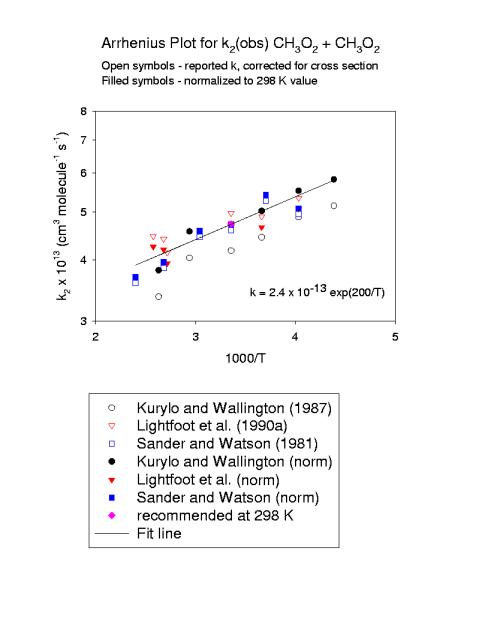
Download high resolution image: pdf
Figure 3. Reaction2 CH3O2 + CH3O2 Kinetics (k actual)
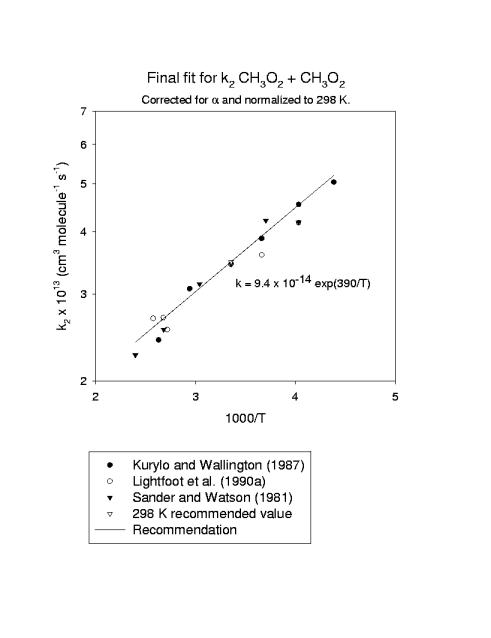
Download high resolution image: pdf
Table 3. Reaction 2 CH3O2 + CH3O2 kinetics
| Reference | k/s·104a | l, nm | s(recc)b | k(obs)c (uncorrected for α) | Temp range (K) |
|---|---|---|---|---|---|
| Kan et al. (1979) | 20.5±2.5 | 265 | 2.48×10⁻¹⁸ | 5.08×10⁻¹² | 296 |
| Sanhueza (1979) | 14.4±1.2 | 254 | 3.47×10⁻¹⁸ | 5.00×10⁻¹² | 298 |
| Sander & Watson (1980) | 28.4±3.610.6±2.5 | 270245 | 2.03×10-184.07×10⁻¹⁸ | 5.77×10-124.31×10⁻¹² | 298 |
| Cox & Tyndall (1980) | 13.3±2.3 | 250 | 3.78×10⁻¹⁸ | 5.03×10⁻¹² | 298 |
| Sander & Watson (1981) | 12.1±0.9 | 250 | 3.78×10⁻¹⁸ | 4.59×10⁻¹² | 248-417 |
| Kurylo & Wallington (1987) | 11.0±1.4 | 250 | 3.78×10⁻¹⁸ | 4.17×10⁻¹² | 228-380 |
| McAdam (1987) | 13.4±2.3 | 250 | 3.78×10⁻¹⁸ | 5.07×10⁻¹² | 298 |
| Jenkin et al.(1988) | 11.1±1.1 | 250 | 3.78×10⁻¹⁸ | 4.20×10⁻¹² | 300 |
| Simon et al. (1990) | 11.6±0.4 | 250 | 3.78×10⁻¹⁸ | 4.39×10⁻¹² | 298 |
| Lightfoot et al. (1990) | 11.7±1.8 | 240 | 4.24×10⁻¹⁸ | 4.96×10⁻¹² | 248-573 |
| Unweighted Average of all | 4.84±0.94(2σ) | ||||
| Without Sander and Watson | Preferred value | 4.72±0.78(2σ) |
a) in units of cmmolecule-1s-1, b) in units of cm-2, c) in units of cm3molecule-1s-1