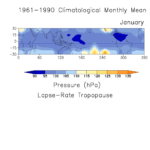
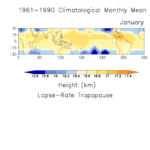
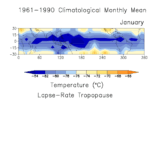
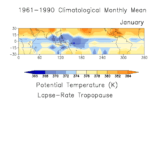
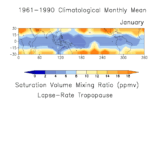
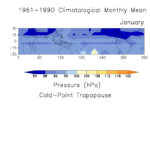
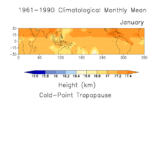
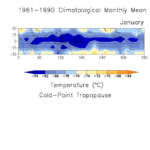
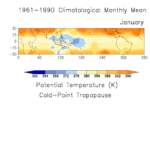
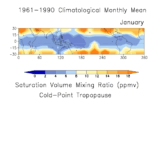
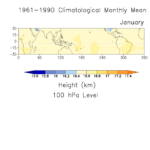
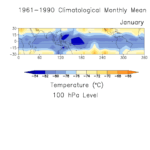
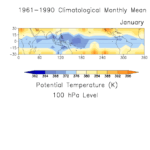
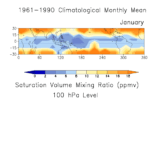
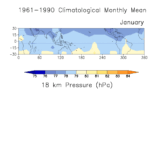
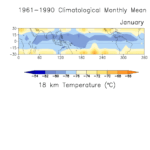
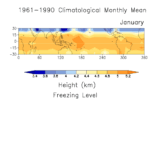
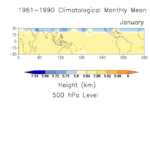
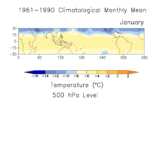
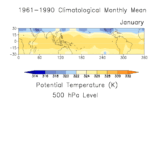
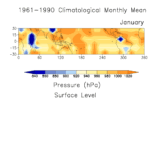
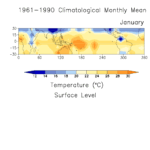
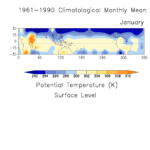
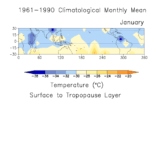
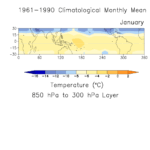
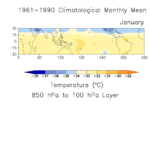
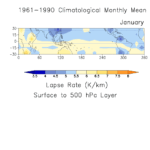
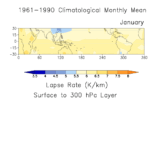
Prepared by Dian Seidel (NOAA Air Resources Laboratory): January 2001
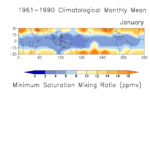
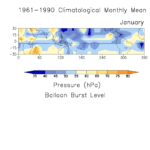
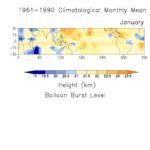
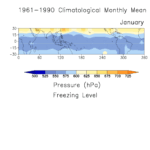
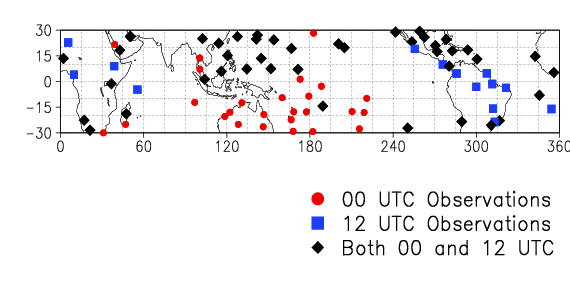
This data set includes climatological monthly statistics, based on radiosonde observations, of 30 characteristics of the tropical (30N-30S) tropopause, troposphere, and lower stratosphere (Seidel et al., 2001; Gaffen et al., 2000). Climatological means and standard deviations are based on data for 1961-1990. Time series of monthly statistics span 1961-1997. A list of the 30 variables can be found below. See below for a map of radiosonde stations or for further station details.
Data are available on CEDA and can be accessed anonymously via:
sparc-ftp.ceda.ac.uk/sparc/noaa_trop/
Please use an ftp client such as FileZilla to connect to the ftp server as many browsers, including chrome, no longer support urls using the ftp protocol.
A FORTRAN routine extract.for is provided for extraction of data from either the gridded data file gridded.dat or the station climatology file station.dat. The file station.list contains a list of stations used in this analysis. Individual station time series files identified by station number and variable name are stored in subdirectory TIMESERS. These files have been concatenated into four tar files for easier downloads. Refer to the README file for further information.
Animations of Climatological Annual Cycles (Monthly Means) provided by Rebecca Ross
Station Details
| Name | Country | Id. No. | Lat. | Lon. (oE) | Elev. | Period | Ob. time (UTC) |
|---|---|---|---|---|---|---|---|
| Abidjan | Ivory Coast | 65578 | 5.25 | 356.07 | 7 | 1961-97 | both |
| Addis Ababa | Ethiopia | 63450 | 9.00 | 38.75 | 2362 | 1961-97 | 1200 |
| Antananarivo | Madagascar | 67083 | -18.80 | 47.48 | 1279 | 1967-97 | both |
| Antofagasta | Chile | 85442 | -23.42 | 289.53 | 114 | 1961-97 | both |
| Ascension Island | 61902 | -7.97 | 345.60 | 86 | 1961-97 | both | |
| Atuona | French Polynesia | 91925 | -9.82 | 220.99 | 52 | 1968-97 | 0000 |
| Bahrain | 40427 | 26.27 | 50.62 | 5 | 1961-79 | both | |
| Bangkok | Thailand | 48455 | 13.73 | 100.55 | 16 | 1961-97 | both |
| Bauerfield | Vanuatu | 91557 | -17.70 | 168.30 | 20 | 1972-97 | 0000 |
| Belem | Brazil | 82193 | -1.38 | 311.52 | 16 | 1968-97 | 1200 |
| Belize | Belize | 78583 | 17.53 | 271.70 | 5 | 1980-97 | both |
| Bloemfontein | South Africa | 68424 | -28.40 | 21.27 | 850 | 1976-97 | both |
| Bogota | Colombia | 80222 | 4.70 | 285.85 | 2541 | 1965-97 | both |
| Brasilia | Brazil | 83378 | -15.86 | 312.07 | 1061 | 1966-97 | both |
| Broome | Australia | 94203 | -17.95 | 122.22 | 12 | 1965-97 | 0000 |
| Brownsville | USA | 72250 | 25.92 | 262.53 | 7 | 1961-93 | both |
| Canton Island | Kiribati | 91701 | -2.77 | 188.29 | 3 | 1961-92 | 0000 |
| Cayenne | French Guiana | 81405 | 4.83 | 307.63 | 9 | 1964-97 | 1200 |
| Charleville | Australia | 94510 | -26.42 | 146.27 | 305 | 1961-97 | 0000 |
| Chi Chi Jima | Japan | 47971 | 27.08 | 142.18 | 8 | 1967-97 | both |
| Clark Air Force Base | Philippines | 98327 | 15.18 | 120.55 | 146 | 1961-90 | 0000 |
| Cocos Island | 96996 | -12.18 | 96.83 | 5 | 1961-97 | 0000 | |
| Curitiba | Brazil | 83840 | -25.51 | 310.83 | 908 | 1965-97 | both |
| Dahran | Saudi Arabia | 40416 | 26.27 | 50.17 | 23 | 1978-97 | both |
| Dakar | Senegal | 61641 | 14.68 | 342.57 | 27 | 1961-97 | both |
| Darwin | Australia | 94120 | -12.43 | 130.87 | 29 | 1961-97 | 0000 |
| Del Rio | USA | 72261 | 29.33 | 259.12 | 314 | 1961-93 | both |
| Douala | Cameroon | 64910 | 4.02 | 9.70 | 10 | 1964-97 | both |
| Durban | South Africa | 68588 | -29.93 | 30.95 | 8 | 1961-97 | both |
| Easter Island | 85469 | -27.15 | 250.52 | 41 | 1966-97 | both | |
| Fort-Dauphin | Madagascar | 67197 | -25.00 | 47.00 | 8 | 1972-97 | 0000 |
| Fortaleza | Brazil | 82397 | -3.72 | 321.45 | 19 | 1973-93 | 1200 |
| Funafuti | Tuvalu | 91643 | -8.52 | 179.22 | 1 | 1973-97 | 0000 |
| Giles | Australia | 94461 | -25.03 | 128.30 | 580 | 1961-97 | 0000 |
| Guam | 91217 | 13.55 | 144.83 | 87 | 1961-97 | both | |
| Hao | French Polynesia | 91944 | -18.10 | 219.10 | 3 | 1971-97 | 0000 |
| Hilo | USA | 91285 | 19.73 | 204.93 | 10 | 1961-97 | both |
| Honiara | Solomon Islands | 91517 | -9.42 | 159.97 | 56 | 1961-97 | 0000 |
| Howard Air Force Base | Panama | 78806 | 8.98 | 280.45 | 16 | 1961-97 | both |
| Isla Guadalupe | Mexico | 76151 | 28.87 | 241.75 | 23 | 1971-97 | both |
| Iwo Jima | Japan | 47981 | 24.78 | 141.33 | 106 | 1961-90 | both |
| Jeddah | Saudi Arabia | 41024 | 21.67 | 39.15 | 10 | 1965-97 | both |
| Key West | USA | 72201 | 24.58 | 278.30 | 1961-93 | both | |
| Khamis Mushait | Saudi Arabia | 41114 | 18.30 | 42.80 | 2060 | 1978-97 | both |
| Kings Park | Hong Kong | 45004 | 22.32 | 114.17 | 66 | 1961-97 | both |
| Kingston | Jamaica | 78397 | 17.90 | 282.72 | 1 | 1961-97 | both |
| Koror | Palau | 91408 | 7.33 | 134.48 | 30 | 1961-97 | both |
| Kota Kinabalu | Malaysia | 96471 | 5.93 | 116.05 | 3 | 1969-97 | 0000 |
| Kunming | China | 56778 | 25.02 | 102.43 | 1892 | 1961-97 | both |
| Lihue | USA | 91165 | 21.98 | 200.65 | 36 | 1961-97 | both |
| Majuro | Marshall Islands | 91376 | 7.10 | 171.40 | 3 | 1961-97 | both |
| Manaus | Brazil | 82332 | -3.15 | 300.02 | 84 | 1967-97 | 1200 |
| Manzanillo | Mexico | 76654 | 19.07 | 255.67 | 3 | 1976-97 | 1200 |
| Mazatlan | Mexico | 76458 | 23.18 | 253.58 | 4 | 1961-97 | both |
| Merida | Mexico | 76644 | 20.97 | 270.48 | 9 | 1961-97 | both |
| Midway Island | 91066 | 28.22 | 182.63 | 13 | 1961-95 | both | |
| Minamitorishima | Japan | 47991 | 24.30 | 153.97 | 9 | 1963-97 | both |
| Naha/Kagamizu | Japan | 47936 | 26.23 | 127.68 | 80 | 1961-97 | both |
| Nairobi | Kenya | 63741 | -1.30 | 36.75 | 1798 | 1961-97 | both |
| Nandi | Fiji | 91680 | -17.75 | 177.43 | 16 | 1961-97 | 0000 |
| Niamey | Niger | 61052 | 13.48 | 2.17 | 233 | 1961-97 | both |
| Norfolk Island | 94996 | -29.05 | 167.93 | 110 | 1961-97 | 0000 | |
| Noumea | New Caledonia | 91592 | -22.30 | 166.45 | 69 | 1961-97 | 0000 |
| Pago Pago | American Samoa | 91765 | -14.33 | 189.28 | 3 | 1966-97 | both |
| Papeete | French Polynesia | 91938 | -17.55 | 210.39 | 2 | 1966-97 | 0000 |
| Port Hedland | Australia | 94312 | -20.38 | 118.62 | 6 | 1961-97 | 0000 |
| Raoul Island | New Zealand | 93997 | -29.25 | 182.08 | 36 | 1961-97 | 0000 |
| Rapa | French Polynesia | 91958 | -27.61 | 215.67 | 1 | 1966-97 | 0000 |
| Rio de Janeiro | Brazil | 83746 | -22.81 | 316.75 | 42 | 1961-97 | both |
| San Jose | Costa Rica | 78762 | 10.00 | 275.80 | 920 | 1972-97 | 1200 |
| San Juan | Puerto Rico | 78526 | 18.45 | 293.90 | 3 | 1961-97 | both |
| Sao Paulo | Brazil | 83780 | -23.62 | 313.35 | 802 | 1961-97 | both |
| Seawell | Barbados | 78954 | 13.07 | 300.50 | 47 | 1965-97 | both |
| Seychelles | 63985 | -4.67 | 55.52 | 3 | 1976-97 | 1200 | |
| Singapore | 48698 | 1.37 | 103.98 | 18 | 1961-97 | both | |
| Songkhla | Thailand | 48568 | 7.18 | 100.62 | 4 | 1961-97 | both |
| St. Helena Island | 61901 | -15.97 | 354.30 | 436 | 1977-97 | 1200 | |
| Tamanrasset | Algeria | 60680 | 22.78 | 5.52 | 1378 | 1961-97 | both |
| Tarawa | Coral Sea Islands | 91610 | 1.35 | 172.93 | 2 | 1961-97 | 0000 |
| Townsville | Australia | 94294 | -19.25 | 146.77 | 5 | 1961-97 | 0000 |
| Truk | Micronesia | 91334 | 7.47 | 151.85 | 3 | 1961-97 | both |
| Wake Island | 91245 | 19.30 | 166.62 | 5 | 1961-97 | both | |
| Windhoek | South Africa/Namibia | 68110 | -22.57 | 17.10 | 1715 | 1961-85 | both |
List of Variables
| Short form name | Variable and units |
|---|---|
| sfc_pres | surface pressure – hPa |
| sfc_temp | surface temperature – C |
| sfc_thet | surface potential temperature – K |
| 500mb_ht | 500 hPa height – m |
| 500mb_TT | 500 hPa temperature – C |
| 500mb_TH | 500 hPa potential temperature – K |
| gamma500 | surface-500 hPa lapse rate – K/km |
| gamma300 | surface-300 hPa lapse rate – K/km |
| sfctrp_T | surface-LRT virtual temperature – C |
| 850300_T | 850 hPa-300 hPa virtual temperature – C |
| 850100_T | 850 hPa-100 hPa virtual temperature – C |
| freeze_p | freezing level pressure – hPa |
| freeze_z | freezing level height – m |
| 100_zzzz | 100 hPa height – m |
| 100_temp | 100 hPa temperature – C |
| 100_thet | 100 hPa potential temperature – K |
| 100_smra | 100 hPa sat. volume mixing ratio – ppmv |
| lrt_zzzz | lapse-rate tropopause height – m |
| lrt_pres | lapse-rate tropopause pressure – hPa |
| lrt_temp | lapse-rate tropopause temperature – C |
| lrt_thet | lapse-rate tropopause potential T – K |
| lrt_smra | lapse-rate tropopause sat. vmr – ppmv |
| cpt_pres | cold-point tropopause pressure – hPa |
| cpt_zzzz | cold-point tropopause height – m |
| cpt_temp | cold-point tropopause temperature – C |
| cpt_thet | cold-point tropopause potential T – K |
| cpt_smra | cold-point tropopause sat. vmr – ppmv |
| min_smra | minimum sat. volume mixing ratio – ppmv |
| 18k_pres | 18 km pressure – hPa |
| 18k_temp | 18 km temperature – C |
References
Seidel, D. J., R. J. Ross, J. K. Angell and G. C. Reid (2001), Climatological characteristics of the tropical tropopause as revealed by radiosondes. J. Geophys. Res., 106, 7857-7878, doi:10.1029/2000JD900837.
Gaffen, D. J., B. D. Santer, J. S. Boyle, J. R. Christy, N. E. Graham, and R. J. Ross (2000), Multi-decadal changes in the vertical temperature structure of the tropical troposphere. Science, 287, 1239-1241, doi:10.1126/science.287.5456.1242.

